TEAM OptOSS AI
-
How do we evaluate/verify our system?
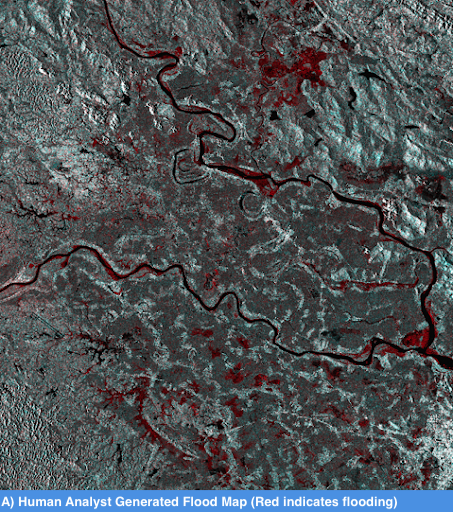
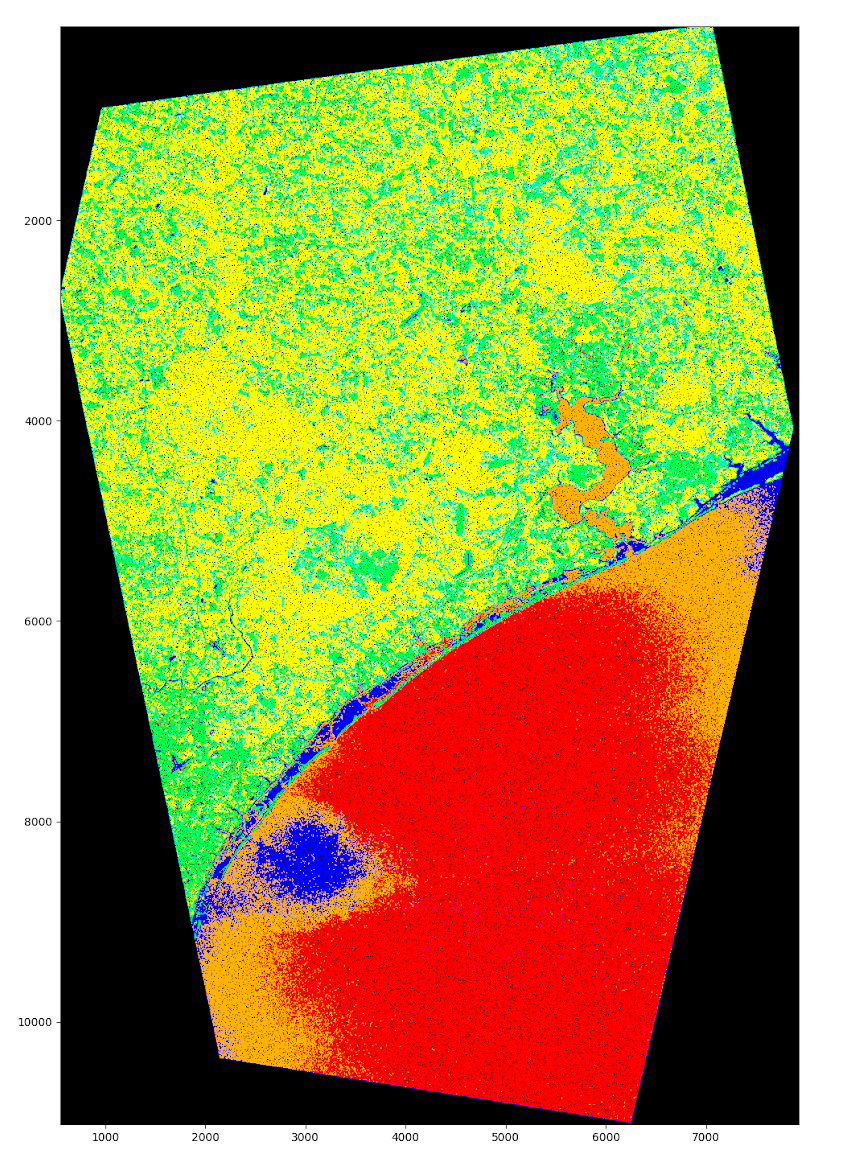
Comparison of various disaster reports from past events is one of the methods that the team is using. As depicted in a sequence of images below, we compared the flood analysis as performed by (A) a human analyst,
B) a sample analysis from the official International Disaster Charter report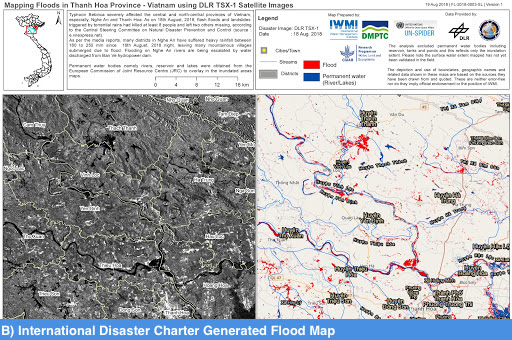
and C) our AI.
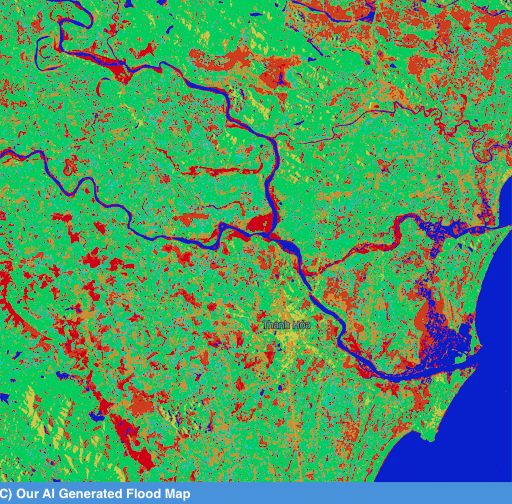
Our AI report was generated in only 5 min and is very rich in details. In contrast, the IDC disaster report took a full day to create! Our AI independently discovered elements of human infrastructure (e.g. roads and cities) as well. At the same time, there are a number of discrepancies among these 3 reports, which indicate regions where our AI was less biased by appearances and only highlighted the differences rather than making assumptions. The analyst likely made a mistake in the IDC report (see the area in the center, where 3 rivers intersect with large flooded areas and partially flooded area as seen at 4 o’clock from the center). Unfortunately, we do not have the means to consistently measure the true accuracy yet. But, we hope that crowd sourced component will help with in-situ verifications of the data as our crowds grow and verification protocols become more mature. It is possible to interact with the prototype of our solution here: Bluemix Demo Environment Once there, just ask the bot to “show anomalies near Hanoi” and click the presented link. -
What kind of historical models do we have access to?
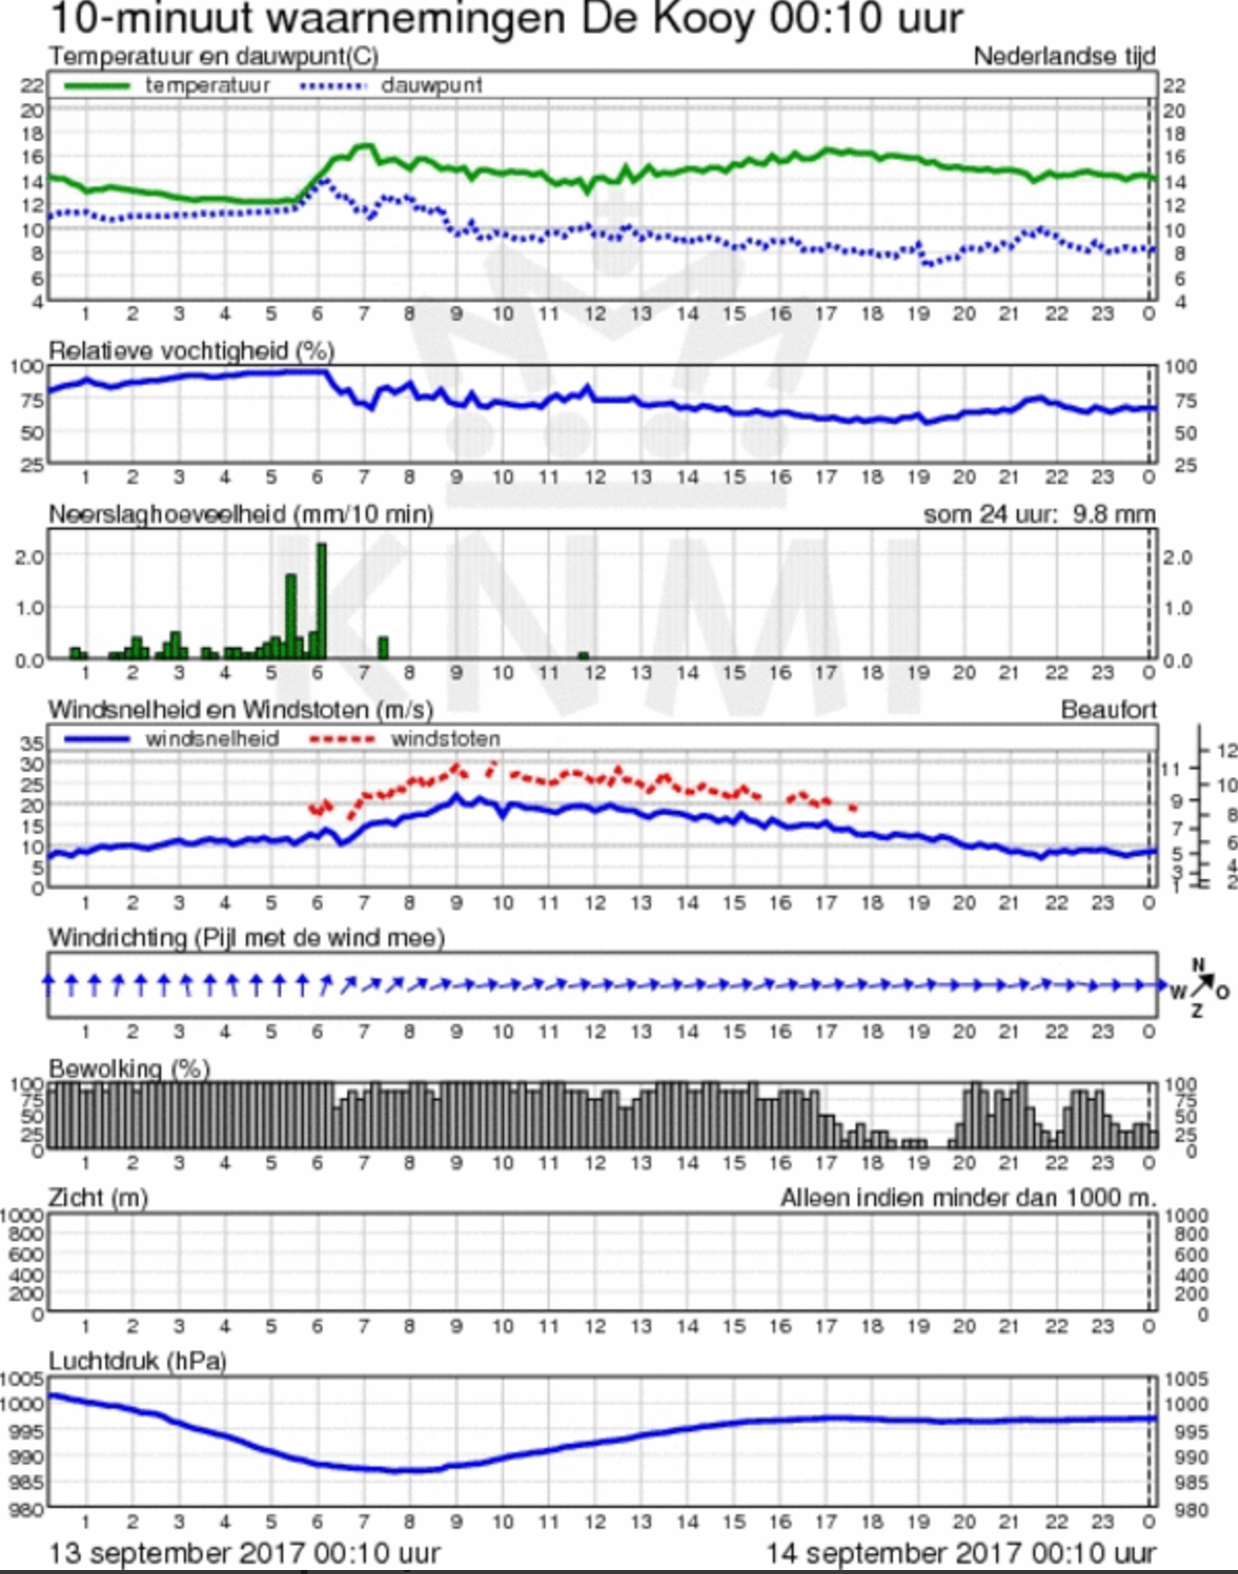
At this moment our team has access to in-situ meteorological data provided by the KNMI (Royal Netherlands Meteorological Institute, in Dutch: Koninklijk Nederlands Meteorologisch Instituut) and IBM The Weather Co.
An example of the meteorological data records which include temperature and dew point, relative humidity, rainfall, wind speed and direction, wind gusts, cloud cover, visibility and air pressure at the measurement site is illustrated below.
We also have access to large data sets for space segment EOD from free open sources provided via Copernicus Data portals (by ESA) and commercial data provided to us by our team’s sponsor - Airbus DS. These data sets are static raw data and has not been annotated by humans. Our patented approach (Dutch patent: 2015680 and International (PCT) Patent Application No. PCT/EP2016/076213) does not require annotated data and works with unstructured unlabeled data, and generates machine labeled data sets as a result. At this time we strive to collect and archive relevant data from recent disasters. The ability to collect and archive a year-long data set is included in the requirement for the pilot deployment next year. -
How can we assess the AI's effectiveness?
As suggested by one of the judges, we will assess the effectiveness of the AI by explicit analysis of k-means clustering classifications in terms of minimizing the error, when compared with the expert and crowd-sourced answers (and if possible verified by the true positives through in-situ verification protocols). This approach might prove effective and economic, especially if we would be able to leverage in-situ verifications enacted by the crowd. One possible method of verification will be to overlay publicly submitted social media images over the mapped area in real time and quantify human and AI effectiveness as a result of in-situ verifications.
-
On what time scales are changes in the EOD measured/reported?
Our team’s solution works with two major types of data. Firstly, it collects the streaming telemetry from in-situ sensors (e.g. meteorological stations, in-situ IoT COTS probes, etc). This telemetry is processed in real time and can produce “severity per second” indications, which enables our AI to trigger alarms in seconds after the template anomaly match is made. Secondly, we also process the satellite image data from hyper- and multi-spectral EOD. Most modern commercial satellites are capable of downlinking the imagery in only 6 minutes after acquisition, enabling our solution to produce analysis in very rapid time. The exact time that it takes to process the data will be measured and documented before the end of the XPRIZE® competition.
-
How do we detect changes in wind speed?
Our original assumption was that it will be possible to measure wind-speed from the recorded Doppler shift present in pairs of inSAR images. Although scientifically possible, this remains one of the more remote goals of our research, because currently available methods and imagery was determined as too coarse for this purpose. In our recent analysis of hurricane Florence our AI still discovered varying concentric circles (wind bands), with a patch of a calm water in the middle - the ‘eye of the hurricane’. Concentric bands represent the varying wind speeds, proving the possibility to eventually use SAR imagery for this purpose. Nevertheless, the team plans to use in-situ data from the real sensors in the first iteration of the solution, since it is the more reliable and precise method of determining wind speed at this moment. Future satellite EOD products should provide us with more data and we will evaluate such data as it becomes available to the team.
-
How can the solution be future-proofed?
Our future proofing efforts are targeted at the technical and software architecture of the solution, which should make it easier to maintain and adapt in the future as things develop.
-
What is the commercial viability of the solution?
We are building an expensive solution that needs expensive data which is hard to collect and get access to. So far the team was using mostly own funding, free open resources provided by ESA, and support from our sponsor Airbus DS. We made it to the point when the prototype of the solution already exists and additional sources of funding and support become available to us from our partners at ESA and IBM. This second wave of support should allow us to build a pilot solution in the Netherlands. We are targeting Copernicus Emergency Services in EU as a possible launching customer and also hope to approach International Disaster Charter via our network of contacts. Also, Cerberus platform is already making very good progress with engagement with paid projects. Free access to the system will be possible and is one of the team’s goals. But in oder to extend the solution on a global basis the team will need proper funding, which might be granted via UN and national support through EU member states, if successful.
-
How do you confirm the accuracy of the crowd-sourced analysis?
Playing as an individual is paramount to the success of the crowd-sourced information. Hence, as a crowd member when you start playing, the area you are requested to map is empty and ready for your input. This area (for example based on a satellite image) is most commonly subdivided in hexagons measuring 120x 104 meaning one hex in the case of a very high-resolution satellite image has a size of 60 x 52 meters (0,5-meter pixel size). As a crowd member you are required to tell which map features are dominant in a hexagon using a pre-defined toolset. In the case of a hurricane this can include: 1: house damage, 2: flooding, 3: broken power cables, 4: obstructed infrastructure, 5: hospitals and 6: anomalies (people can textually annotate if something is unexpected. If many people do this, the location is worth investigating). Other disasters/ events have different tool sets, which are customizable. For example, in Iraq, the Sinjar mountain region we were tasked with searching for refugees. When marking a feature with a tool on a hexagon you get a reward. The height of this reward is based on what other individual crowd members say about this same hexagon. For example, in the linear example when 4 other crowd members before you have said there is a road in this hexagon and you also say there is a road you get a score of 5. This score is part of a virtual in game currency allowing you to upgrade components of your game. Using this method, the crowd is incentivized to perform their best, since when you map correctly the probability for good rewards are highest. A critical point is that even the best people make errors, and for the system this is totally ok. What happens if you make an error, your score is low, and the central database will treat this result as an outlier. Hence, we will only use results where a certain amount of crowd members reach consensus. The threshold where we treat something as true and thus use the information to ‘draw’ our maps depends on a certain threshold of people to blindly agree (typically if n is equal or less than 3) in relation to the total size of the population mapping the area. Please note the method is originally designed and tested during the “Mars Crowdsourcing Experiment, Woud 2011” then refined over the years and now patented in the Netherlands and the US (Method and apparatus for generating map data from images, Issued Jul 31, 2018 Patent issuer and number us US 10,037,611 B2). To go into the question, the crowd members do not confirm accuracy, that is being done on the system side performing statistics over all the crowd results. Verification of the results has been carried out many times ranging different subjects and different methods. Some examples are during the Mars Crowdsourcing Experiment where crowd generated data was peer compared with Nasa Scientists or for example the crowd results have been in-situ verified during an expedition in the desert of Utah mapping geology and during a campaign where Cerberus was used to detect among other things palm oil plantations in Ghana Link.
-
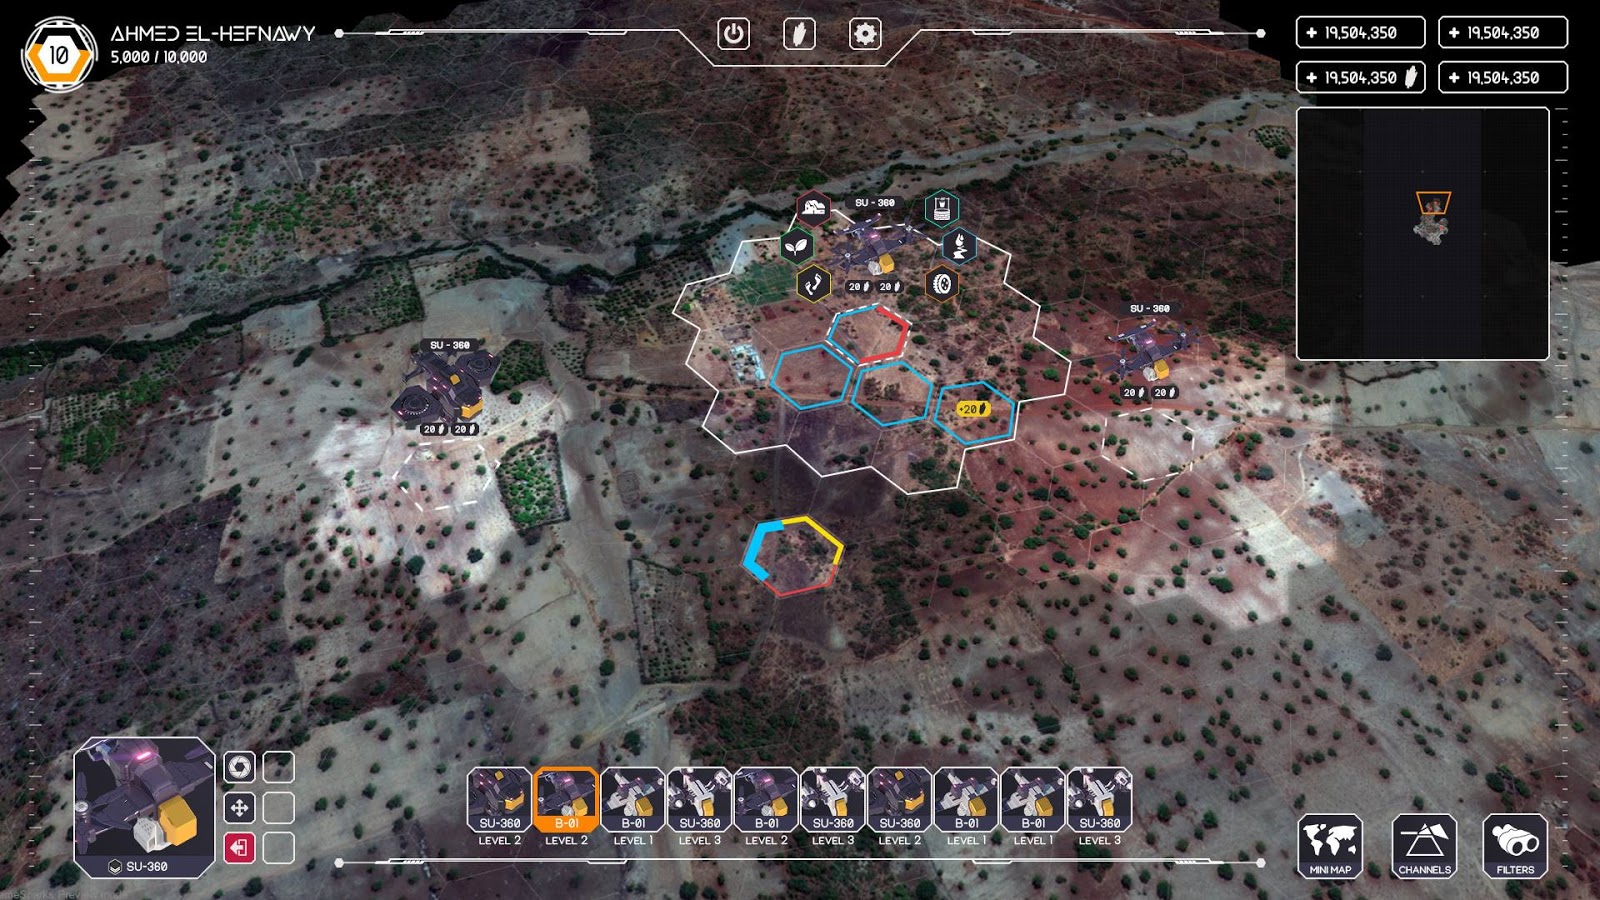
How much does the success of the project depend on popularity of the game?
In late 2017 BlackShore was granted a European Space Agency co-funded demonstration project allowing us to scale world wide and build the next generation of the crowdsourcing platform. The agency funds 50% of the project whereas the other 50% comes from 5 end-users, AWS, a bank grant, and BlackShore’s own resources. Regarding this project, the next iteration of Cerberus is coming online late 2018 where we will carry out at least 7 crowdsourcing campaigns ranging the globe. Topics are agriculture, illegal logging, illegal fishing, drivers for human conflict and water resiliency. At the start we have a crowd population of 3000 allowing us to carry out smaller scale projects, but it is our goal to grow to 200,000 in 2020. Crowd is accumulated through 3 strategies: 1: classic Facebook advertising (on Facebook we manage the crowd), 2: Publicity through articles, partners and news items. 3: Viral marketing meaning we will reward the crowd for a more interesting game if they invite their friends. See the next image for the next iteration of Cerberus to be released.
-
What is the profile of the users of the game, and how will you acquire them?
Already with the “Mars Crowdsourcing Experiment, 2011” we were able to prove the amateur crowd performs faster, more thorough, and just as precise as experts. The crowd covers more ground in a smaller amount of time while the statistics make sure the results are clear. On doing this the following two elements are critical for success: 1) the motivational elements to keep the crowd going, here game elements come in. 2) e-learning elements. It is critical we first teach the crowd on what to expect and what to look for. We even must teach to crowd on how to play with multispectral capabilities of satellites. This teaching experience is seamlessly built into the game play. This means the actual learning process to the crowd does not feel as an excessive effort. We call this learning by doing. Creating the learning materials is quite an effort. We must produce understandable descriptions and example images which must then be test in ‘pre-mapped’ areas to test the crowd’s performance. Only when people have completed these areas they are welcomed to start carrying out the true mapping (for example click Here)